
Turn your business data into clear insight
Most businesses already sit on plenty of useful data — in spreadsheets, databases, and the tools they use every day. The problem is rarely a lack of data; it’s that the data is scattered and hard to read.
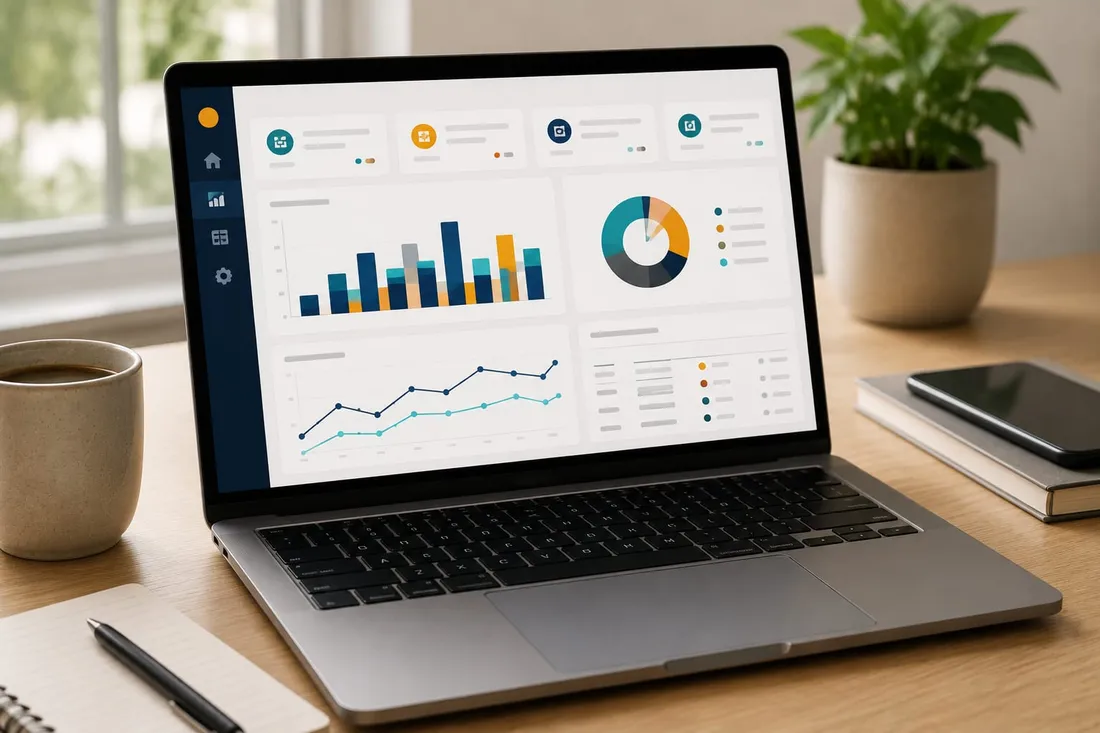
Do It Better I.T. uses Power BI to bring that data together into clear dashboards and reporting, so you can see how things are tracking at a glance.
Why this matters
When reporting is messy or manual, decisions get made on guesswork and important trends get missed. Clean dashboards turn scattered numbers into something you can actually use.
What is included
This service covers Power BI dashboard design, connecting your data sources, building clean and readable reports, and setting up refreshable reporting where suitable — along with practical guidance on reading and acting on the numbers.
Who this is for
This service is ideal for small businesses that want clearer reporting and a simple way to see how the business is tracking, without hiring a full data team.
Want clearer reporting?
If you want to turn your spreadsheets and systems into clear Power BI dashboards, get in touch and explain what you’d like to see — and the right reporting approach can be planned.
